>>Return to Tell Me About Statistics!
This time, we continue to explain the theme of normal distribution.
This test checks whether the population of sample data follows a normal distribution. Known tests include the Kolmogorov-Smirnov test, Lilliefors test, Shapiro-Wilk test, and goodness-of-fit test.
Among these, we explain “Testing for goodness of fit.”
What is a goodness-of-fit test?
The goodness-of-fit test is a chi-square test, which is a method for statistically determining the equality of frequencies in a frequency distribution (simple summary table) and the normality of the frequency distribution. For each category in the frequency distribution table, the expected frequency is calculated according to the standards established by statistics.
The expected frequency for determining equivalence is the same value for all categories, and the expected frequency for determining normality is a theoretical value calculated from normal analysis.
The test statistic is calculated from the discrepancy between the actual and expected frequencies. Under the null hypothesis that the observed and expected frequencies are equal, the test statistic follows (approximately) a chi-square distribution.
A chi-square distribution is used to calculate the probability p-value of the test statistic, and the p-value is used to determine the equality and normality of the frequencies of occurrence of the frequency distribution.
Procedure for goodness-of-fit test when checking normality
The goodness-of-fit test is performed using the following steps.
- Create a null hypothesis
- The actual frequency of the frequency distribution in the population matches the expected frequency (the theoretical frequency of the normal distribution).
- The frequency distribution in the population is normal.
- Create an alternative hypothesis
- The actual frequency of the frequency distribution in the population does not match the expected frequency (the theoretical frequency of the normal distribution).
- The frequency distribution in the population is not normal.
- Perform only two-sided tests (no one-sided test)
- Calculate test statistics
- Calculate p-value
- Chi-square distribution
- Determine significant difference
- p value < significance level 0.05:
- Reject the null hypothesis and adopt the alternative hypothesis.
- Not a normal distribution.
- p-value ≧ significance level 0.05:
- Cannot reject the null hypothesis and does not adopt the alternative hypothesis.
- It cannot be said that it is not a normal distribution.
- This does not mean it is a normal distribution.
- p value < significance level 0.05:
Results of goodness-of-fit test (normality)
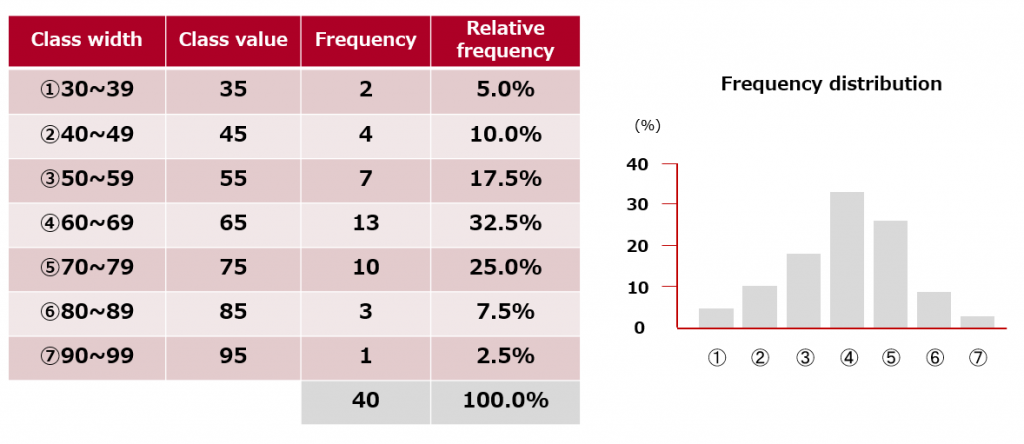
Suppose that you randomly select 40 people from a nursing school and give them a statistical test.
The figure shows the frequency distribution and a histogram of the test scores. Let us use a significance level of 5% to determine whether the statistics grades in nursing schools as a whole are normally distributed.
[Figure]

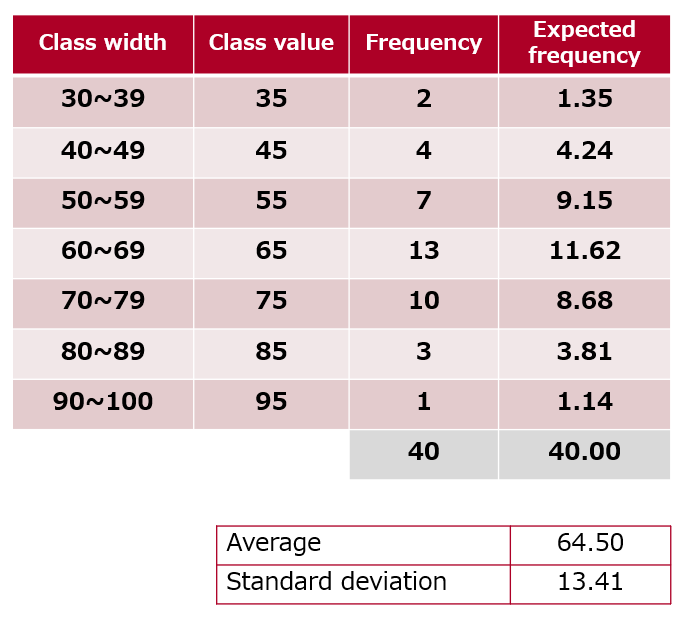
Find the expected frequency (theoretical frequency) by applying a normal distribution to the frequency distribution in the table.
[Table1]

[Table2]Test results

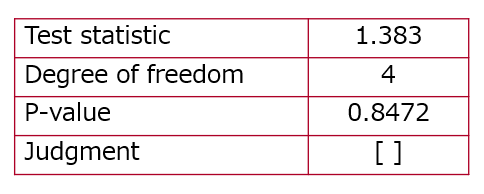
If the p-value is less than or equal to the significance level (0.05), we decide to reject the null hypothesis and accept the alternative hypothesis, concluding that the frequency distribution in the population is not normal.
If the p-value is greater than the significance level (0.05), the null hypothesis cannot be rejected, and the alternative hypothesis is not adopted.
As we do not accept the theory that it is not a normal distribution, we cannot say that it is a normal distribution. There is insufficient evidence from this judgment to conclude that the distribution is not normal.
Note that when the sample size is small, it is possible to conclude that the histogram is normally distributed, even though the shape is not. It is necessary to calculate the skewness and kurtosis of the survey data and confirm that the data are normally distributed.
>>Return to Tell Me About Statistics!


Comments are closed